
GIS Specialist
About me
Hello, everyone! I'm Alan Wu, a highly motivated GIS professional based in Toronto, Canada. With a Master's Degree in Geomatics for Environmental Management and a strong background in GIS analysis and development, I am passionate about leveraging spatial data to uncover insights and drive informed decision-making. My proficiency in Cutting-edge tools enables me to conduct geospatial data analysis. Let's explore the world through data and maps together!
Skills
GIS Analysis Softwares
Web GIS Development
GIS Skills
Education Background

The University of British Columbia
Master's Degree
Master of Geomatics for Environmental Management
Jul 2022 - May 2023
Vancouver, BC, Canada

University of Toronto
Bachelor's Degree
Mathematics Major & Environmental Science Major
Seb 2019 - Jun 2022
Toronto, ON, Canada
Working Experience

Blue Ventures
GIS Analyst - Capstone project
2022 Sep - 2023 Apr
Vancouver, BC, Canada
ESRI, ArcGIS pro, QGIS, R, Tableau, Excel
• Performed data collection and analysis of PlanetScope satellite imagery with R and ArcGIS pro to create highly
detailed maps with 100 times higher spatial resolution covering over 10,700 sq km of mangroves
• Utilized QGIS to derive CRAs of 9 different land cover types, and achieved overall accuracies of over 90% for
identifying 3 classes of mangrove subtypes using R-built supervised classification models
• Created and presented data visualizations in Tableau and Excel to showcase key insights on mangrove
dynamics in Northwestern Madagascar, informing conservation efforts and management strategies.

Alpha Libertée
Environmental Sustainability Researcher
Feb 2022 - Mar 2022
Toronto, ON, Canada
Python, Tableau, Research
• Researched Carbon Footprint generated by Hut 8 Mining Corp during transactions of tokens, and presented
findings to Hut 8 stakeholders led to a 20% decrease in Scope 1 and Scope 2 Emissions
• Improved the accuracy of AI assistant Daisy's prediction on effective methods to reduce CO2 output of tokens by
25% through training with Chia Network's use of low-capacity HDDs to keep low energy costs
• Developed a comprehensive 20-page report on the best ways to limit emissions caused by electricity
consumption of mining operations, which included a dashboard and a predictive model built with Python ,
resulting in a 30% increase in data readiness and efficiency.

Beijing Sanjin Fengqing Catering Management Co., Ltd.
Data / Business Analyst
Sep 2020 - Jun 2021
Beijing, China
Python, R, SQL, Excel
• Utilized SQL and Python (Pandas) to clean and integrate data from the company's POS system, improving the
personalized guest experience and raising positive ratings from 90% to 97% by analyzing order preferences,
reservation habits, and demographics
• Built predictive models using Python and R to forecast future revenue with over 80% accuracy, reduce food
waste by 30%, and optimize staffing by predicting customer trends and busiest time periods.
• Collaborated with cross-functional departments like Marketing to create a Lunchtime Voucher named YinPiao,
which increased customer loyalty and generated around 3000 revisits and $42,000 in revenue over 3 months.
Projects
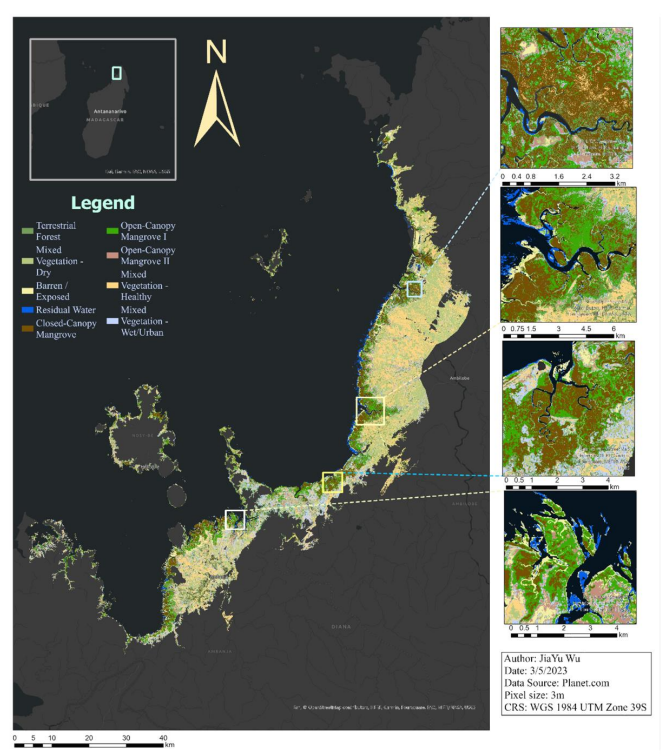
Recent studies have addressed mangrove deforestation using remote sensing. This study examined mangrove distribution in Northwestern Madagascar using high-resolution imagery, comparing it to traditional methods. The study generated a detailed multi-date map. Challenges with classification models were identified, highlighting the potential and limitations of fine resolution satellite imagery.
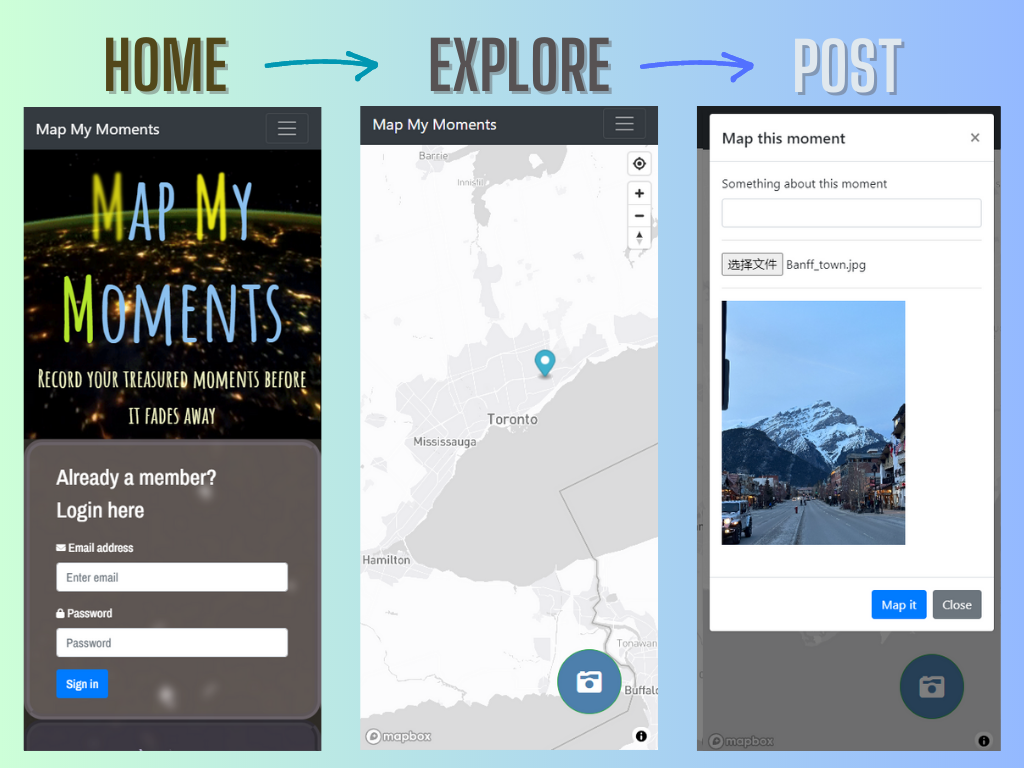
Developed a secure web GIS app for data sharing and mapping with a user-friendly interface and offline access similar to Snapchat. Techniques like HTML, CSS, JavaScript, Mapbox were used. Steps including steps of setting authentication systems and accounts, building UI, converting website to PWA, customizing map style, posting and feeding data, and hosting. Customized map style increased engagement by 30% and data sharing by 20%. Thorough testing resulted in a 99.9% error-free app, receiving positive feedback for interface and security.
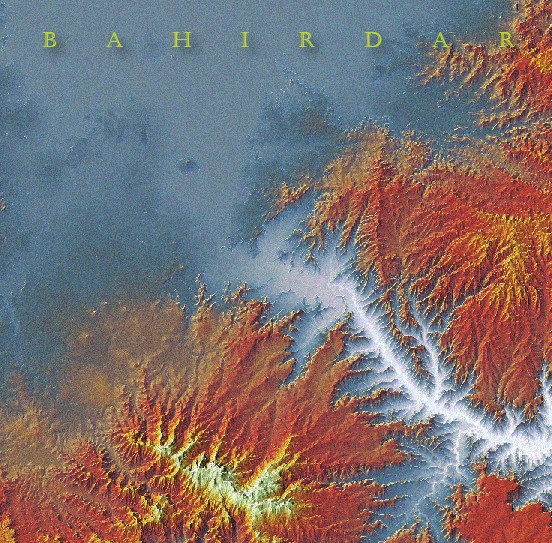
Experience the mesmerizing 2.5D map of Bahir Dar, Ethiopia. Created from a single DEM file, it utilizes the Plan Oblique tool by Ken Field for the striking effect. Steps include downloading the DEM, using ArcGIS Pro's "Terrain Tools," and enhancing textures with hill-shade, slope functions, and Adobe Illustrator for texts and fonts.
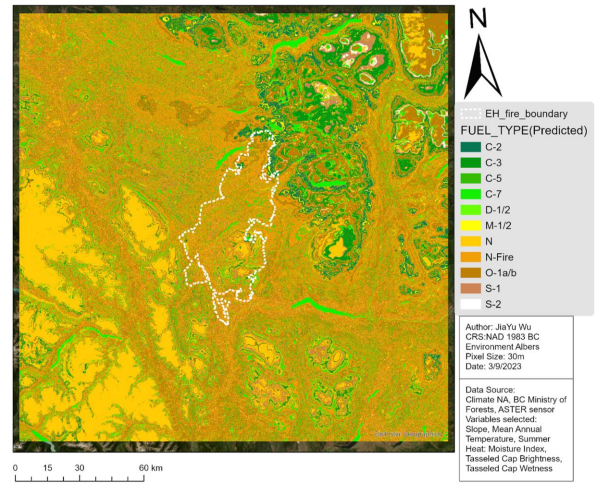
This project explores machine learning in ArcGIS Pro to predict fuel-related variables in a post-burn scenario. Steps involve checking spatial autocorrelation, selecting relevant input variables, creating sample datasets, and using a Random Forest classifier to generate prediction surfaces. The study area focuses on the Elephant Hill wildfire in southern BC.
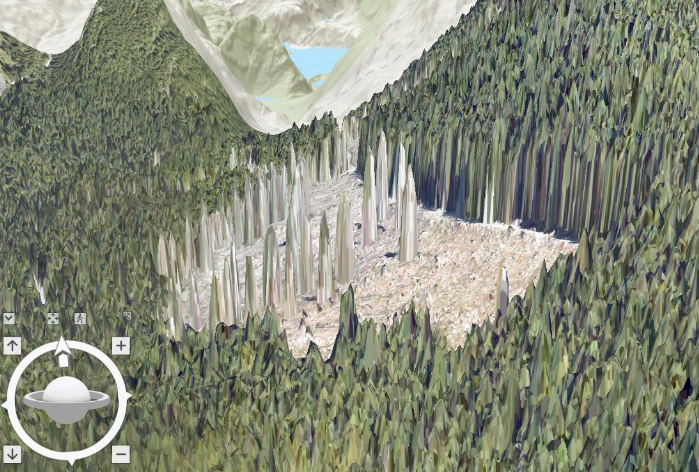
The project involved using LiDAR data from the Malcolm Knapp Research Forest (MKRF) to create digital terrain models (DTMs) using spatial interpolation techniques. The project focused on inverse distance weighting (IDW), kriging, and spline methods, comparing their strengths and weaknesses. Additionally, 3D visualization in ArcGIS was explored. Maps was created to display the interpolated surfaces and differences between them.
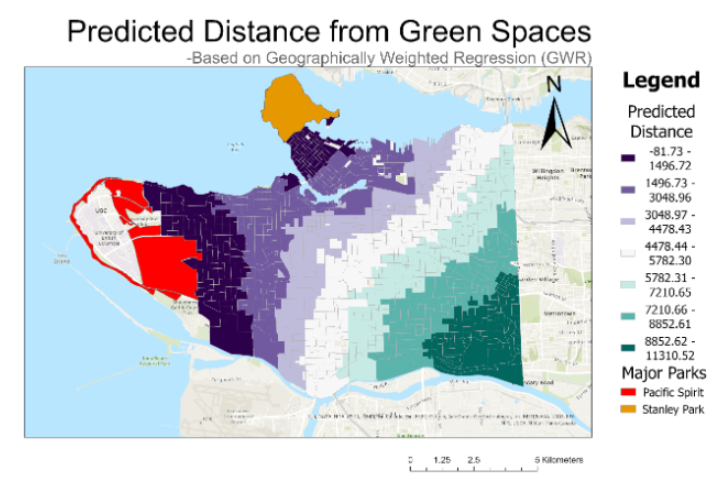
This project used geographically weighted regression (GWR) to analyze the relationship between green spaces and demographic variables in Vancouver. GWR provided more precise estimations than ordinary least squares (OLS), with a higher R-squared value. Important variables included population density, low-income households, education level, median income, age, unemployment rate, language spoken, and immigration status.
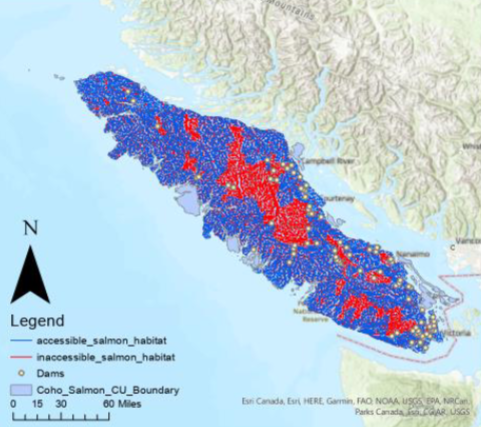
This project examines the accessibility of Coho salmon habitat on Vancouver Island. The analysis is based on large-scale observations using flow accumulation and stream network data derived from a digital elevation model (DEM). It was found that only a fraction of the total salmon habitat is accessible, primarily due to the presence of steep mountains in the island's inland area.
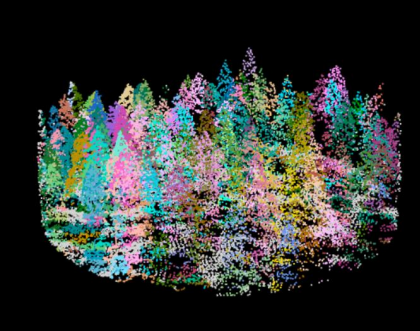
This project involves using lidar data to detect individual trees in a forest. It focuses on two methods to detect trees: point cloud and canopy height model (CHM). Steps involve extracting point clouds for each plot location and removing outliers before using the segment_trees function to detect individual trees in the lidar data.
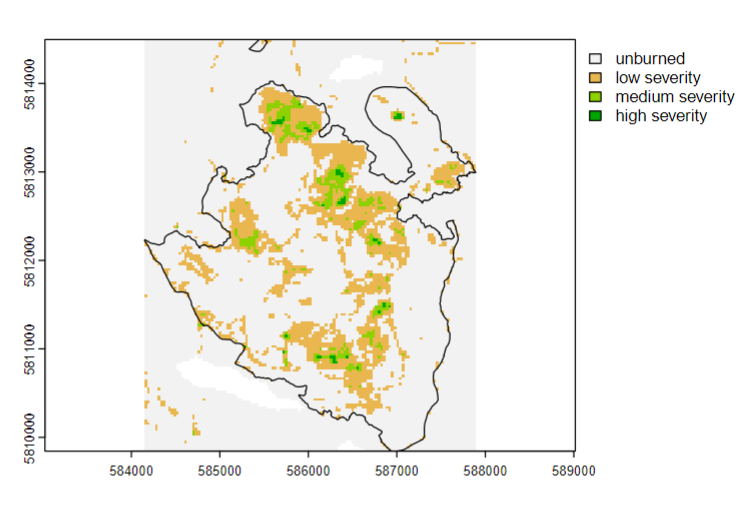
This project used R to analyze the fire burn severity and post-fire vegetation recovery of the Prouton Lakes fire using Landsat time-series data. It quantified burn severity, calculated vegetation indices, created yearly composites, classified burn severity, and examined post-fire vegetation recovery. The results were visualized through figures and included analyzing historical fires in BC, creating NDVI composites, and comparing NDVI values per burn severity class.
Made with ❤ by Alan | Email : alanwuapplication@gmail.com | Phone : +1 (647)-354-9777